Introduction
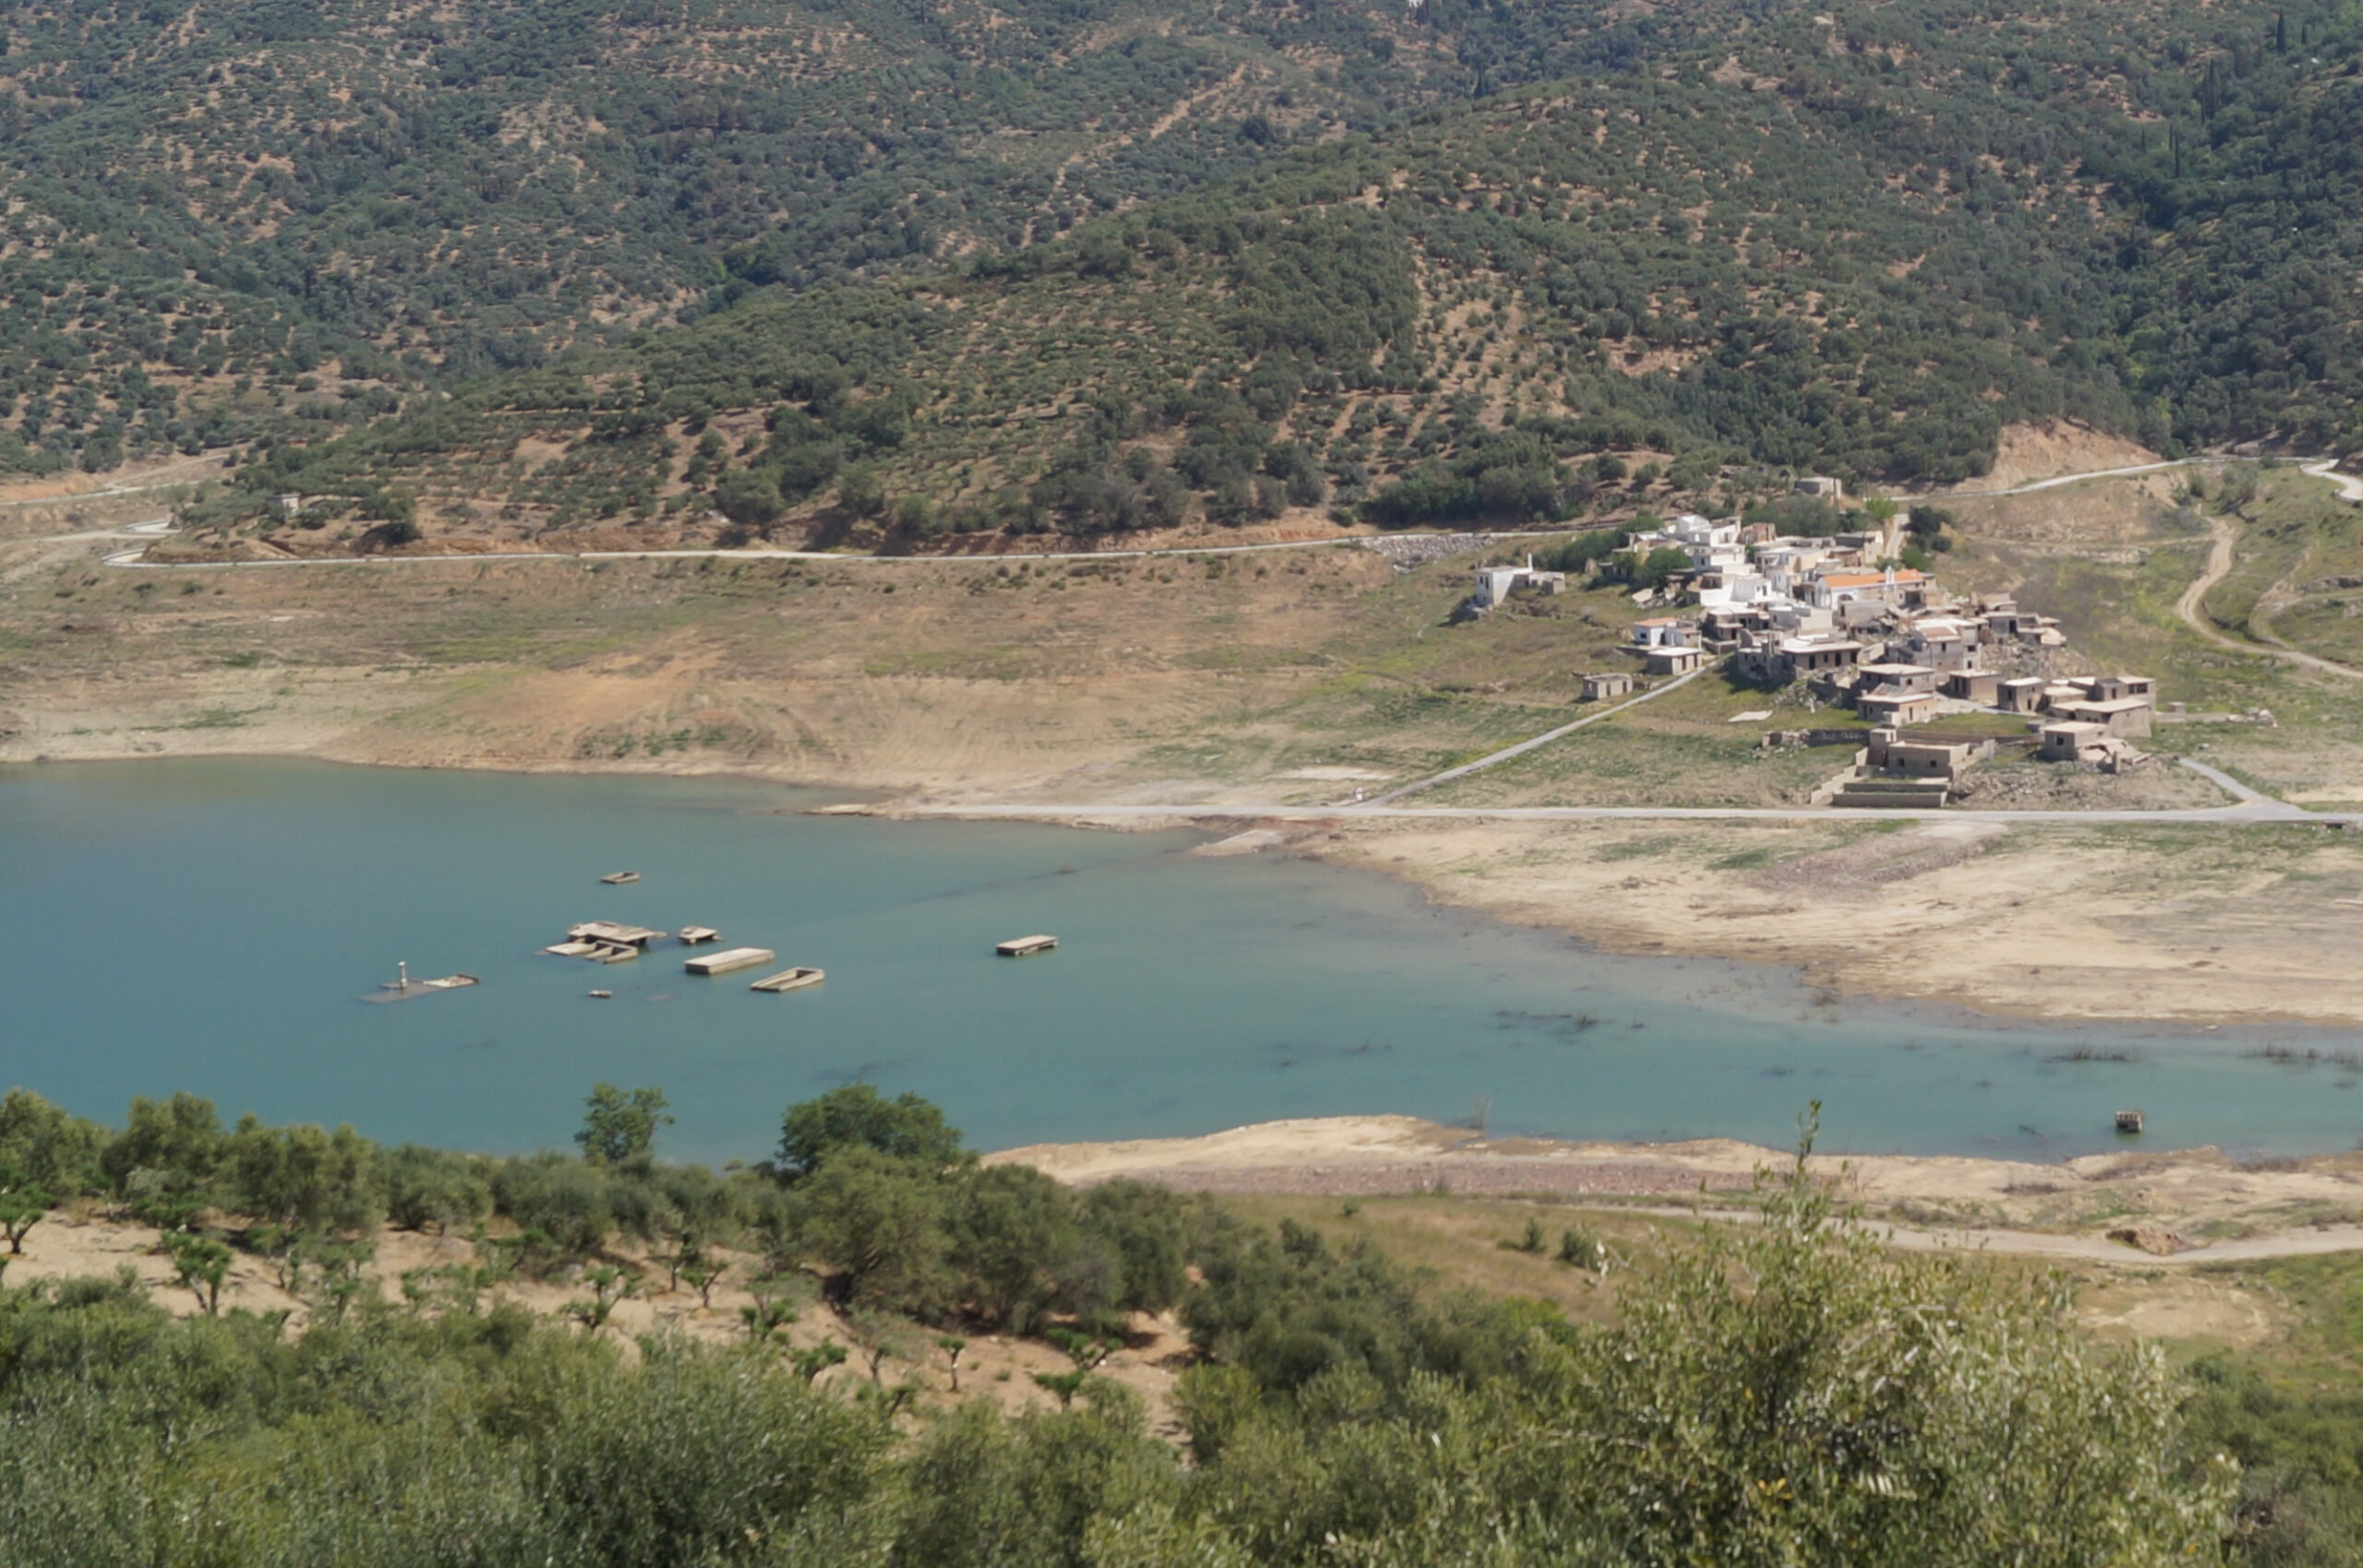
Water scarcity continues to be a pressing global challenge, threatening communities, industries, and ecosystems alike. Effectively monitoring freshwater resources is critical for sustainable water management, especially in regions where seasonal variability and prolonged droughts strain existing supplies. This is where remote sensing technology comes into its own: high-resolution satellite imagery can reveal invaluable insights into how bodies of water evolve over time. Here we tap into the power of Synthetic Aperture Radar (SAR) data from the European Space Agency’s Sentinel-1 satellite to assess the storage of Aposelemis dam, the largest water management project in Crete. The satellite-based assessement is validated using information from the local press (Figure 1).
Methodology
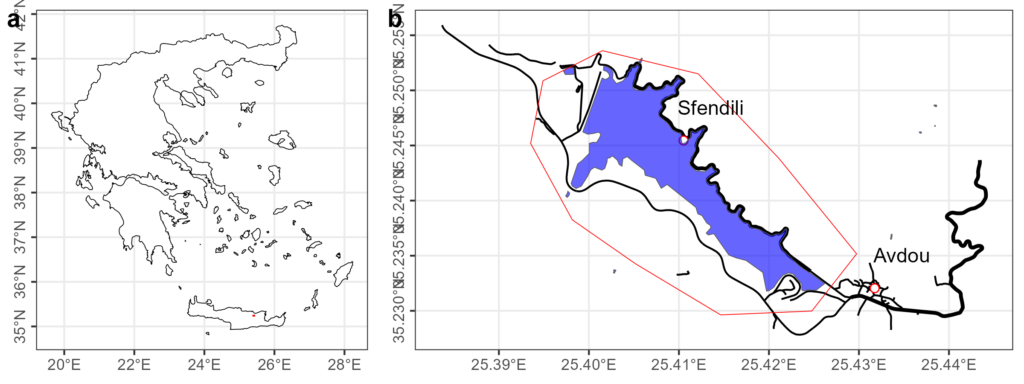
Synthetic Aperture Radar (SAR) data from the Sentinel-1 satellite was utilized to analyze water bodies in the region of interest (ROI), defined by a custom polygon geometry (Figure 2). The analysis was performed using Google Earth Engine (GEE), leveraging its computational power for large-scale remote sensing data processing. Sentinel-1 Ground Range Detected (GRD) imagery, acquired in the VV polarization mode, was selected from the COPERNICUS/S1_GRD image collection for the period between October 3, 2014, and today. To enhance image quality and reduce speckle noise inherent to SAR data, a median focal filter with a 100-meter radius was applied to the VV band. A water classification algorithm was subsequently implemented, using a threshold of -15 dB on the filtered VV band to delineate water bodies. The resulting binary classification was added as a new band to the dataset. To facilitate temporal analysis, the SAR imagery was further filtered to identify the image closest to a specific target date, enabling consistent comparisons over time. All processing steps were performed using custom functions developed in the GEE JavaScript API and executed through the R programming environment using the rgee package.
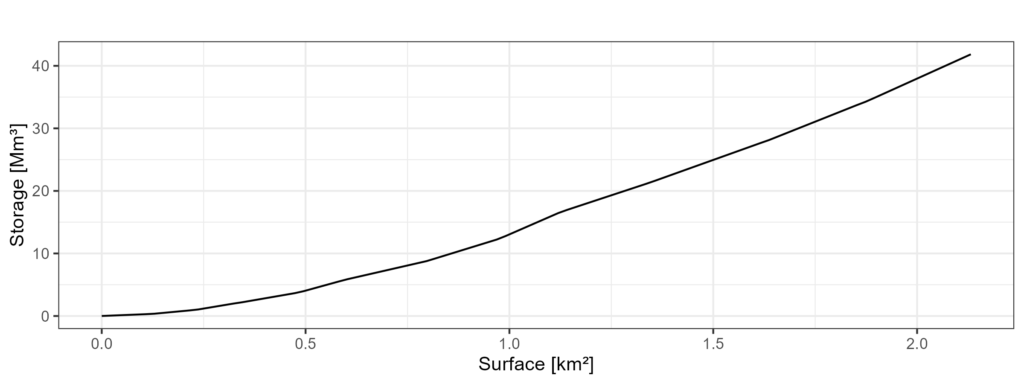
To calculate the storage, a surface-volume curve of the Aposelemis reservoir was constructed (Figure 3) using the surface-level and level-storage curves of the study by A.D.K. and Watson (1998) as shown by Koutsoyiannis et al. (2001). Obviously, the curve does not refer to the current situation as it predicts surfaces and storages greater than 1.9 km2 and 27.3 Mm3, respectively.
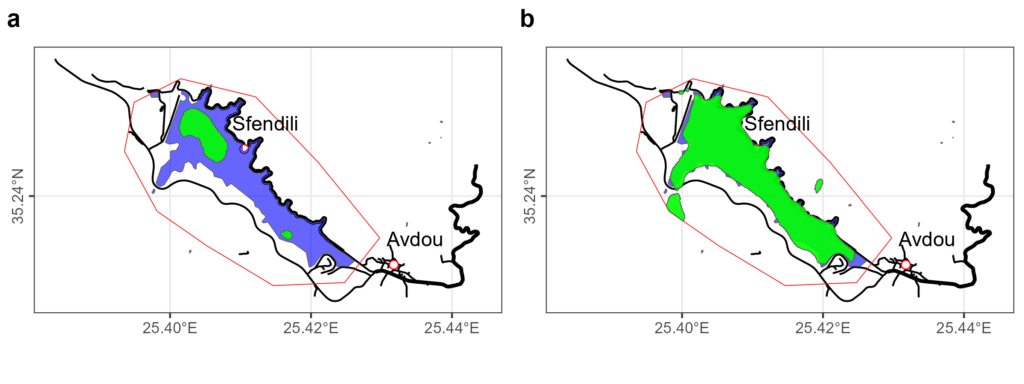
Following the methodology, the change in storage of the Aposelemis reservoir from 2014 to the present was calculated. Indicatively, for the minimum and maximum levels, Figure 4 presents the surface of the reservoir as calculated from satellite data. As shown in Figure 1, storage estimates show an excellent fit with measured data, as this has been documented in the local press.
References
Α∆Κ and Watson, Hydrology – Report, Aposelemis Dam – Final study, Directorate of Water Supply and Sewerage Works, Ministry of Environment, Spatial Planning and Public Works, Athens, 1998.
Koutsoyiannis, D., I. Nalbantis, N. Mamassis, A. Efstratiadis, L. Lazaridis, and A. Daniil, Flood study, Engineering consultant for the project “Water supply of Heracleio and Agios Nicolaos from the Aposelemis dam”, Commissioner: Ministry of Environment, Planning and Public Works, Contractor: Aposelemis Joint Venture, Athens, October 2001.
South, A. (2017). R Package: rnaturalearth. World Map Data from Natural Earth, Version 0.1. 0. Available online: https://cran. r-project. org/web/packages/rnaturalearth/rnaturalearth. pdf
Padgham, M., Lovelace, R., Salmon, M., & Rudis, B. (2017). osmdata. Journal of Open Source Software, 2 (14).